Recently, a research team led by Prof. Sheng-Qi Zhou from South China Sea Institute of Oceanology proposed an integrated method to calculate thickness of oceanic bottom mixed layer (HBML), and for the first time, obtained the global distribution of HBML. The research results have been published in Journal of Atmospheric and Oceanic Technology, https://journals.ametsoc.org/doi/full/10.1175/JTECH-D-18-0016.1 and Geophysical Research Letters, https://agupubs.onlinelibrary.wiley.com/doi/10.1029/2018GL081159, respectively.
With the development of research on abyssal ocean, the bottom mixed layer (BML), which is the only pathway for communication between the ocean interior and underlying, has received unprecendented attention. In earlier studies a threshold method was the main approach employed to determine coarse HBML. Zhou’s team proposed an integrated method based on the relative variance method, using the possible HBML values obtained from the threshold, curvature and maximum angle methods to optimize the final results. The integrated method was examined to be prior to other available methods.
Over 30,000 full-depth conductivity-temperature-depth (CTD) profiles archived by the World Ocean Circulation Experiment (WOCE) Program were used to obtain the first approximation of the global distribution of HBML (Figure 1). They found that HBML had inhomogeneous distributions in different ocean basins and appeared thicker around mid-ocean ridges. In particular, the median HBML values were 40, 42, 64 m in the Atlantic, Indian, and Pacific Oceans respectively, and 47 m globally, as shown in figure 2. Statistically, maximum values for HBML occured around 20°N or 20°S, and the stratification appeared to reduce HBML based on the weak dependence on the buoyancy frequency. In the abyssal ocean, HBML became thicker in the deeper ocean (D), according to a statistical fitting result of an exponential function of HBML = 26.34+0.85exp(D/1271.8).
The work was supported by National Natural Science Foundation of China and the National Natural Science Foundation of Guangdong Province, China, Guangzhou Science and Technology Program key Project, and the Research Programs of the Chinese Academy of Sciences.
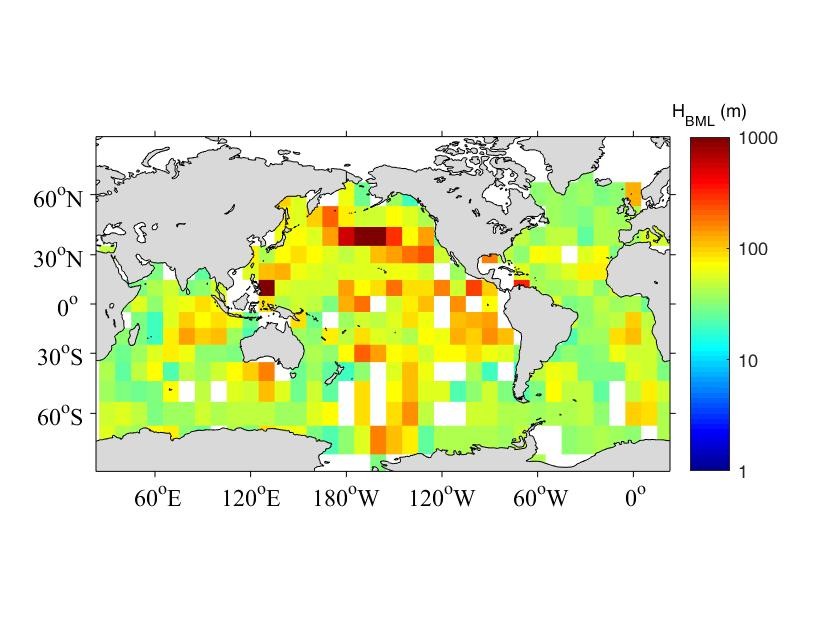
Figure 1. Global map of BML thickness averaged in 10°×10° bin.
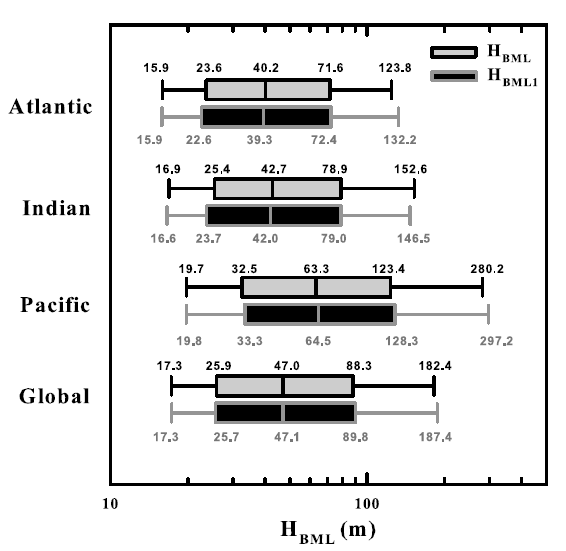
Figure 2. box-whisker plots of HBML.

 粤公网安备44011502001245号